
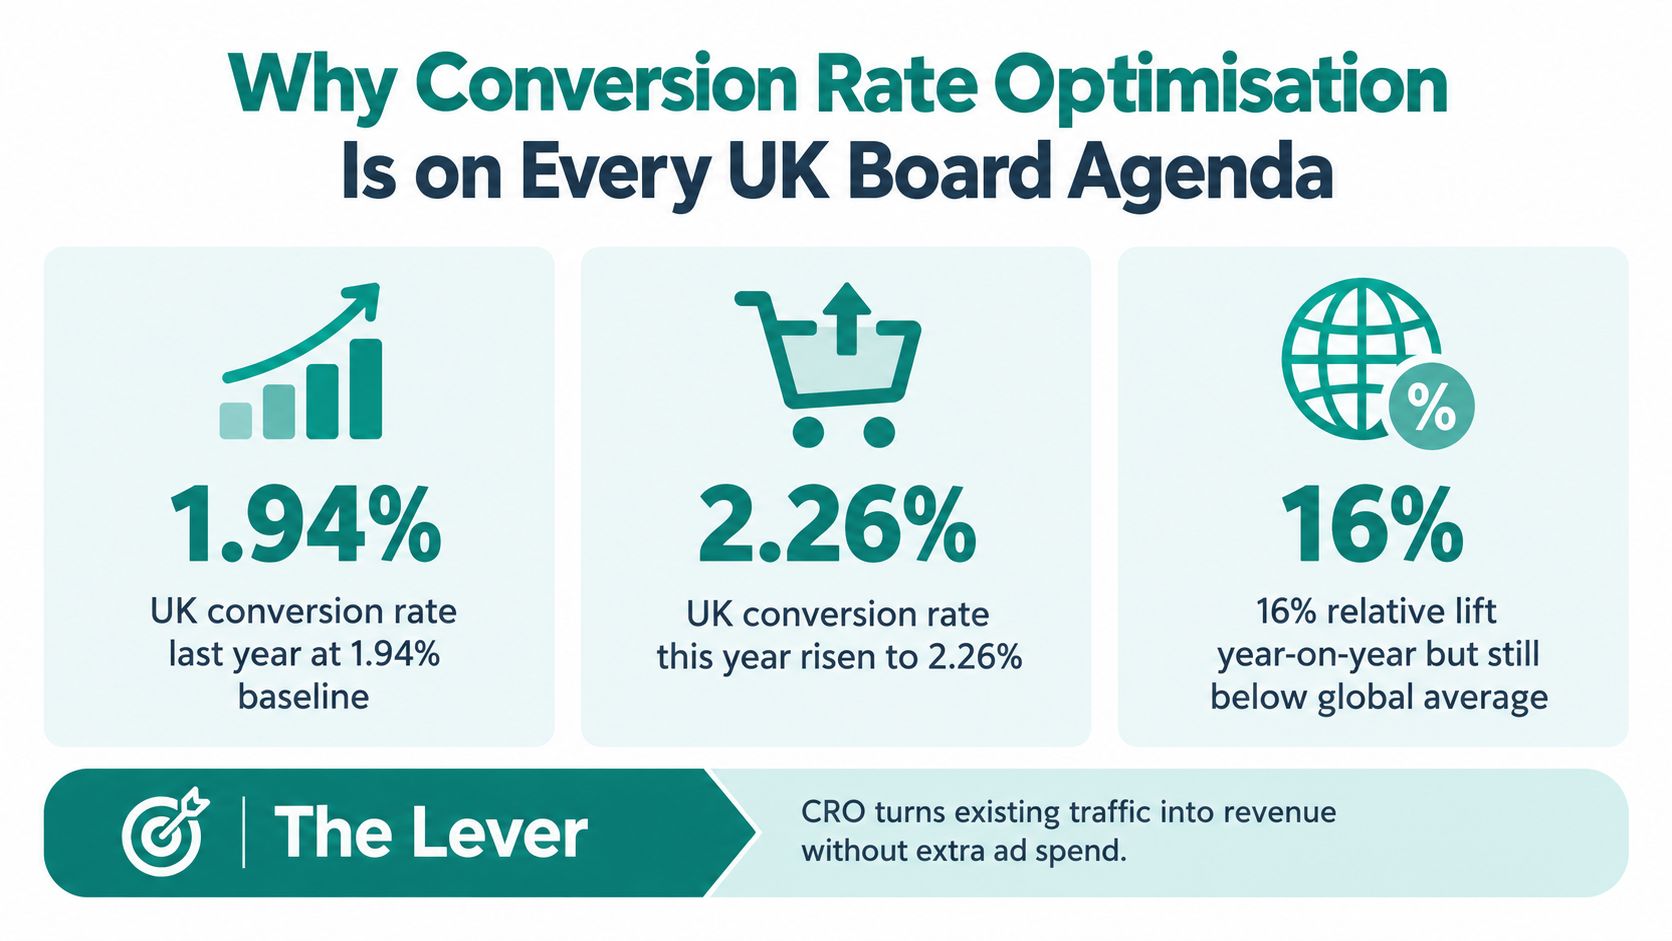
UK ecommerce conversion rates rose from 1.94% to 2.26% year on year, which is a 16.17% increase on live merchant data. That sounds small until you attach revenue to it, and that's exactly why conversion rate optimisation UK work has moved out of the marketing corner and onto the board agenda in 2026.
Most CRO advice is still rubbish. Too much of it lives at the level of button colours, trust badges and tidy little homepage tweaks, as if revenue moves because someone rounded a corner radius in Figma.
It doesn't.
What usually moves the number is less glamorous: cleaner tracking, faster pages, category-aware targets, fewer checkout steps, clearer delivery information, and a testing discipline strong enough to admit that most ideas won't win. That's the bit a lot of agencies skip, because “we ran six losing tests and learned something useful” is harder to sell than “we redesigned your PDP”.
Table of Contents
- Why Conversion Rate Optimisation Is on Every UK Board Agenda
- What Conversion Rate Optimisation Actually Means in Practice
- The Three Working Methods of UK CRO Programmes
- Where CRO Meets SEO, Analytics and Core Web Vitals
- Typical UK CRO Deliverables, Pricing and Engagement Shape
- A/B Testing in the UK and Why Most Tests Lose
- UK Benchmarks, Mobile Friction and Checkout Reality
- Hiring a UK CRO Consultant or Agency Without the Theatre
Why Conversion Rate Optimisation Is on Every UK Board Agenda
The clearest proof that CRO matters in the UK is that the market benchmark itself moved. IRP Commerce reported UK ecommerce conversion rising from 1.94% in July 2025 to 2.26% in July 2026, a 16.17% year-on-year increase across live merchant data, which makes a strong case for treating conversion as a commercial lever rather than a minor website tidy-up (IRP Commerce UK ecommerce market data).
That matters because conversion is one of the few growth levers that doesn't automatically demand more traffic, more media spend or more content production. If traffic is flat but more of those sessions turn into revenue, finance teams pay attention quickly. They should.
Why finance people care now
The part many marketers miss is that CRO is easier to defend internally than another acquisition push. Paid media budgets are visible. SEO investment can take time. Conversion work sits closer to realised revenue, so boards can understand it without a long explanation.
UK recruitment data backs that up. IT Jobs Watch recorded 98 permanent UK jobs citing Conversion Rate Optimisation in the six months to 20 September 2026, versus 93 in the same period of 2025 and 38 in 2024. Those roles represented 0.084% of all UK permanent jobs in the period, with a median annual salary of £44,500 in 2026, down from £51,500 in 2025 (IT Jobs Watch conversion rate optimisation jobs).
That's not niche-tactic territory anymore. It's a recognised operating discipline.
Practical rule: when a capability starts showing up consistently in hiring data, businesses have usually stopped seeing it as an experiment.
What boards are really buying
Boards aren't buying “optimisation”. They're buying a better yield from traffic they already paid for. In practice, that means asking harder questions:
- Where does intent leak out? Product page, basket, delivery step, or payment.
- Which device is dragging the blended number down? Usually mobile.
- Which category deserves attention first? The one with enough traffic and enough margin to matter.
- Can we trust the measurement? If the tracking is messy, the whole discussion is theatre.
That's the shape of conversion rate optimisation UK work when it's done properly. Not aesthetics first, not opinions first, and definitely not “best practice” copied from a US SaaS blog onto a British retail site.
What Conversion Rate Optimisation Actually Means in Practice
In plain English, conversion rate optimisation means finding where people hesitate, get confused or lose confidence, then fixing those points in a way you can measure. It isn't just checkout work, and it isn't just testing. It runs across landing pages, category pages, product pages, forms, search, basket flow and post-click reassurance.
The cleanest way to think about it is this: SEO earns the visit, paid search buys the visit, design shapes the presentation, and CRO tries to turn that visit into money or leads.
CRO is separate from SEO, but they overlap
I spend a lot of time explaining that CRO isn't a substitute for SEO, and SEO isn't a substitute for CRO. A page can rank well and still under-convert. A beautifully designed page can still attract the wrong traffic. A paid campaign can drive loads of visits into a weak journey and scale the waste.
Here's the simplest breakdown.
| Discipline | Primary Goal | Headline Metric | Typical Time to Impact |
|---|---|---|---|
| CRO | Turn more existing visitors into customers or leads | Conversion rate, revenue per session, completion rate | Short to medium term |
| SEO | Earn qualified organic traffic | Rankings, clicks, organic sessions | Medium to long term |
| Paid search | Buy targeted visits quickly | ROAS, CPA, revenue | Short term |
| Design | Improve clarity, trust and usability | Engagement, task completion, stakeholder approval | Varies by rollout |
What practitioners actually use
A serious CRO setup is usually a stack, not a single tool. GA4 handles funnels and event tracking. Hotjar, FullStory or Microsoft Clarity help you watch what people do. Testing platforms such as Optimizely, VWO, AB Tasty or Convert help you ship experiments without turning every change into a dev bottleneck.
For ecommerce teams trying to convert more traffic on Shopify, that kind of stack matters because the problem usually isn't one dramatic flaw. It's a handful of frictions across collection pages, product pages and mobile checkout that add up.
A good CRO process feels more like operations than creativity. You collect evidence, form a view, ship changes, then check whether the number moved for the reason you thought it would.
Why the discipline has matured
In the UK, CRO now sits in that awkward but useful space between marketing, product and analytics. That's healthy. It means fewer vanity redesigns and more work tied to observed behaviour.
The practical difference is simple. A weak CRO programme says, “we think this page needs refreshing.” A strong one says, “users are dropping at this step, mobile is underperforming desktop by too much, and we can see the friction in replay data.”
The Three Working Methods of UK CRO Programmes
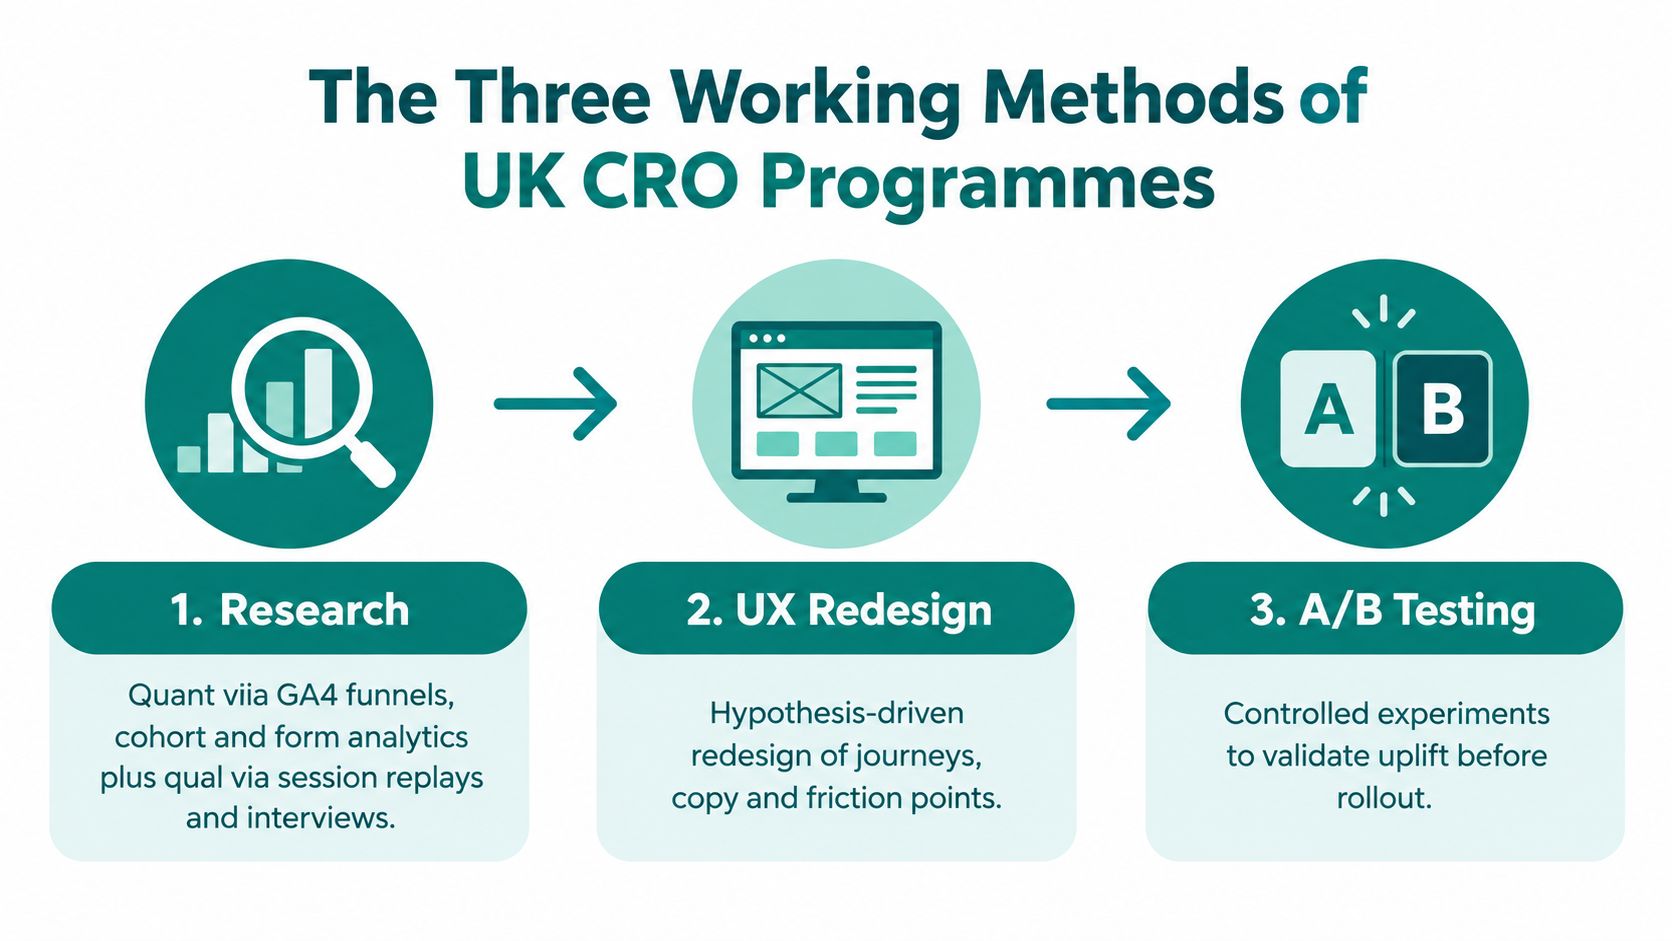
The best UK CRO programmes tend to use three methods together: research, UX redesign, and A/B testing. Used alone, each one has blind spots. Used together, they give you a monthly operating loop that's a lot harder to fool.
Research finds the leak, not the fix
Research comes first because otherwise you're just decorating guesses. On the quantitative side, that usually means GA4 funnel exploration, path reports, landing page performance, form analytics and cohort patterns. On the qualitative side, it means session replays, on-site polls, customer service themes, sales call notes and customer interviews.
Research is excellent at spotting patterns. It can show that people stall on delivery pages, rage-click on mobile menus or keep returning to size guidance before buying. What it can't do on its own is prove causality.
That matters. If people drop at a step, the step might be the problem, or it might be where uncertainty becomes visible.
UX redesign fixes obvious friction fast
When a journey is clearly broken, redesign work usually delivers the biggest immediate gain. Not because redesigns are magic, but because some sites make buyers work far too hard.
That kind of work often includes:
- Heuristic reviews: checking whether layout, hierarchy and page structure match buyer intent.
- Friction audits: looking for unclear shipping info, poor filter logic, clumsy forms or broken mobile interactions.
- Information architecture fixes: reorganising categories, internal paths and product discovery so users can get to a decision faster.
Redesign is powerful, but it has a weakness. If you roll out a large change all at once, you may improve the journey without knowing exactly which element did the heavy lifting.
A useful walkthrough of the process sits below.
A/B testing proves causality, slowly
A/B testing is where you stop arguing about opinions and let traffic decide. You test one version against another and measure whether the chosen metric moved enough to act.
Its strength is precision. Its weakness is constraint. You can only test what gets enough traffic, on pages that can technically support a controlled variant, over a long enough period to trust the result.
Research tells you where to look. Redesign gives you candidates for improvement. Testing tells you whether the idea deserved to survive.
The teams that get the best from conversion rate optimisation UK work don't treat these as alternatives. They run them together and accept the trade-offs of each.
Where CRO Meets SEO, Analytics and Core Web Vitals
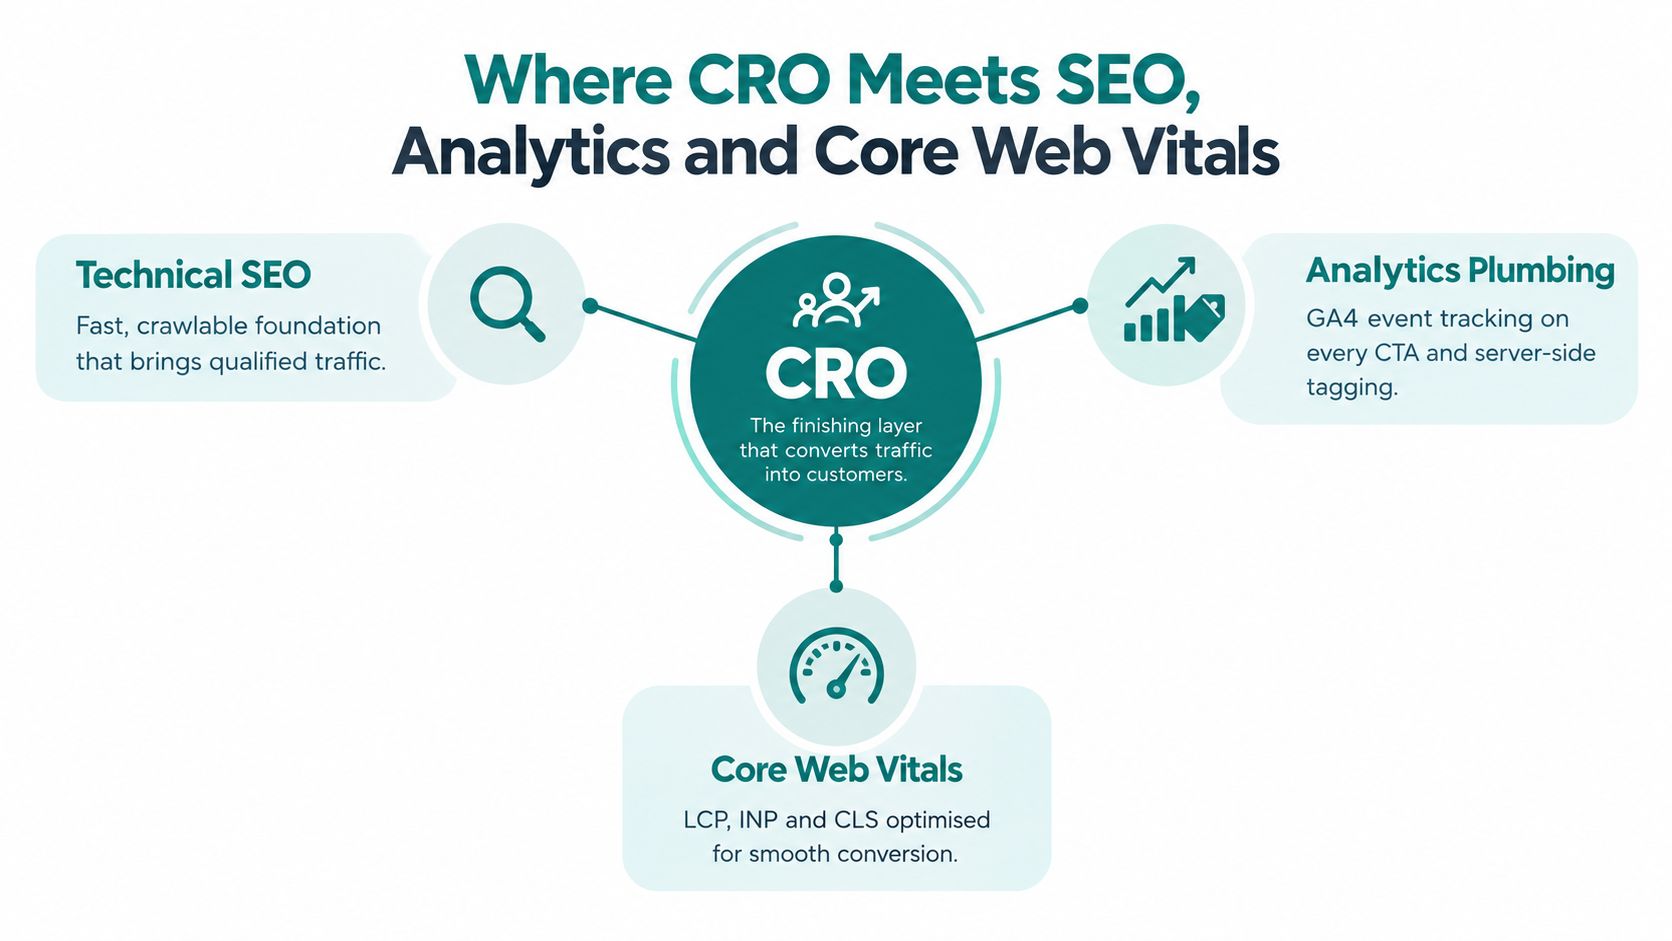
CRO works best when it sits on top of a sound technical base. If the wrong traffic lands on a page, if tracking is half missing, or if the page feels slow on a real phone, you'll spend months “optimising” the wrong problem.
SEO brings intent, CRO monetises it
SEO's job is to send the right people to the right pages. That means crawlable templates, sane internal linking, sensible taxonomy, strong category targeting and content that matches a real query. If you're mapping journeys across informational and commercial pages, this guide to organising content with topic clusters is a useful way to think about content structure before people ever hit a product page.
That's also why I don't like the old split where SEO owns traffic and CRO owns conversion as if they never touch. They meet on the landing page. If SEO brings broad, weak intent to a page built for decisive buyers, conversion suffers. If CRO improves a page that ranks for the wrong terms, the lift often disappoints.
Analytics is the plumbing
Good CRO measurement usually looks boring, and that's a compliment. You need clean event tracking on key CTAs, clear definitions for primary actions, and reporting that joins landing pages to outcomes rather than obsessing over isolated page metrics.
For the technical side of performance and UX, I'd also look at Core Web Vitals explained as part of the same conversation, not a separate SEO chore.
Speed and mobile behaviour matter more than most teams admit
UK benchmark guidance makes two useful points. First, mobile conversion can sit materially below desktop, and a practical rule of thumb is that mobile performance under 40% of desktop suggests structural UX issues, 40% to 55% is normal, and above 55% is strong. Second, the technical floor still matters: Largest Contentful Paint should be 2.5 seconds or less and Interaction to Next Paint 200 milliseconds or less for conversion-focused builds (UK ecommerce conversion benchmark commentary).
That doesn't mean every conversion problem is a speed problem. It means page weight, script bloat, image handling and mobile checkout behaviour belong inside CRO conversations, not outside them.
If your PDP looks fine on a MacBook and stalls on a mid-range Android over 4G, your conversion problem isn't “creative”. It's operational.
Typical UK CRO Deliverables, Pricing and Engagement Shape
A credible CRO engagement should produce real working outputs, not just a presentation deck and a few opinions dressed up as strategy. What that looks like varies by site size, platform complexity and traffic volume, but the shape is usually consistent.
The first thing I look for is whether the engagement separates research, implementation, and testing discipline. If all three are blurred together, clients often struggle to work out what they're paying for.
What a solid engagement should include
In practice, monthly deliverables often look like this:
- A prioritised hypothesis backlog: ranked by likely revenue impact, implementation effort and testability.
- A research log: findings from analytics, replays, customer support themes and journey reviews.
- Experiment read-outs: what ran, what happened, what metric mattered, and whether to roll out or retire.
- A delivery roadmap: quick UX fixes alongside slower tests and deeper structural work.
Ownership terms matter more than people think. Variant code, design files, tracking setup and raw findings should remain accessible to the client. If a contract ends, you shouldn't lose the ability to understand or keep the winning changes.
Pricing is all over the place, so judge the output
There isn't a single standard UK rate card for CRO, and that's part of the problem. Pricing depends on who is doing the work, whether design and development are included, and how much traffic exists to support testing.
| Engagement type | Typical UK price | Core deliverables | Typical length |
|---|---|---|---|
| One-off CRO audit | Varies by provider and site complexity | Analytics review, UX audit, research findings, prioritised recommendations | Short project |
| Ongoing retainer | Varies by provider, testing scope and build support | Research, backlog management, design input, experimentation and reporting | Ongoing |
| Embedded consultant support | Varies by seniority and internal team setup | Strategy, QA, analytics oversight, test review and team guidance | Flexible |
For a broader view on how digital pricing is usually packaged, SEO pricing packages are useful context because CRO often gets bundled with technical work, analytics and landing page improvement rather than sold as a pure line item.
What I'd ask before signing
A decent provider should be able to answer three simple questions without squirming:
- What gets delivered each month?
- Who owns the assets and test learnings?
- How are decisions made when a result is negative or inconclusive?
One sensible option in the mix is Sibley Digital, which combines SEO, web development and conversion measurement for ecommerce and lead generation sites. That setup can suit businesses that need implementation and tracking fixed alongside CRO work, not just advice.
A/B Testing in the UK and Why Most Tests Lose
Most A/B tests lose. That is normal, and any UK CRO programme that suggests otherwise is usually selling theatre, not measurement.
UK-focused testing data covering 2,408 tests run between January 2023 and March 2026 found that only 17.4% produced a statistically significant winning variant, while 74.2% were inconclusive or showed no detectable difference. That is roughly one winner in seven, based on UK A/B testing statistics.
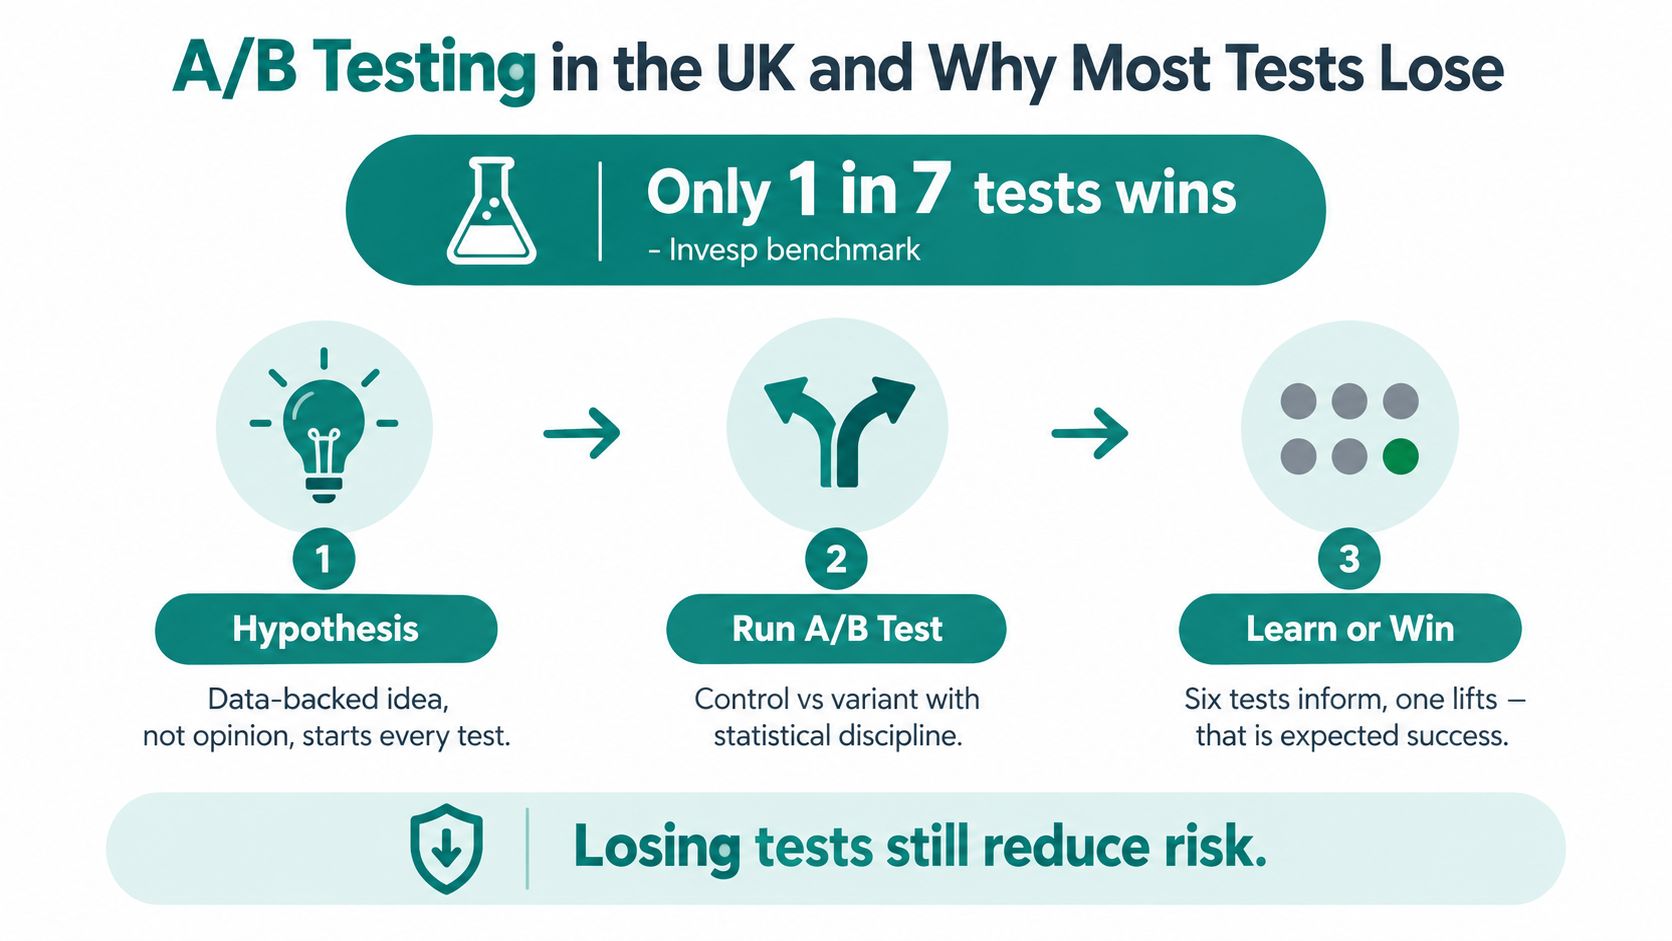
That hit rate is not a problem to solve away. It is the cost of running honest experiments instead of retrofitting a success story onto random movement in the numbers.
A lot of losing tests fail for dull, predictable reasons. The hypothesis is weak. The change is cosmetic. Traffic is too thin to support a clean read. Someone checks the dashboard after three days, sees a temporary lift, and calls it insight.
The same UK dataset found a median requirement of 14,800 sessions per variation to detect a 5% minimum detectable effect on a 3% baseline at 95% confidence and 80% power. For many UK lead gen pages, category pages, and lower-volume ecommerce templates, that immediately changes the economics of testing. If a page gets a few thousand sessions a month, a standalone A/B test may be the wrong tool.
That is where trade-offs matter. High-traffic pages can support controlled experiments. Lower-traffic pages often need a different approach: stronger user research, sharper analytics, and larger UX changes shipped with careful before-and-after measurement. Purists dislike that because it is less tidy than a clean split test. In practice, it is often the only sensible way to improve revenue on smaller UK sites.
Why statistical discipline still matters
A practical rule in the UK is still 95% confidence, which means a p-value at or below 0.05, and the usual guidance is to wait for both adequate sample size and a full traffic cycle of at least 1 to 2 weeks before calling a result (A/B test significance guidance).
That does not make testing exciting. It makes it usable.
I would also set guardrails before launch. Revenue per visitor, lead quality, refund rate, basket size, form completion quality, or bounce rate can all matter more than a narrow headline conversion lift. A variant that gets more form fills but tanks qualified leads is not a winner. It is a reporting problem.
What good UK testing teams actually do
The teams worth listening to write the test plan before they touch the page. They define the primary metric, guardrail metrics, minimum detectable effect, segmentation rules, and stopping criteria. Then they review the losers properly, because a failed test can still expose weak assumptions about intent, device behaviour, or page friction.
Tools such as Optimizely, Convert, AB Tasty, VWO and Statsig can support that process. None of them can rescue a weak hypothesis, poor instrumentation, or a page with nowhere near enough traffic to reach a decision.
UK Benchmarks, Mobile Friction and Checkout Reality
Generic benchmark talk is one of the easiest ways to confuse yourself. UK conversion rates vary sharply by sector, so a blended average can make a perfectly normal site look broken, or flatter a weak one.
In January 2026, one UK benchmark reported an overall ecommerce conversion rate of 1.51% and a median of 1.45%, with a spread from 0.53% in electrical and commercial equipment to 4.82% in arts and crafts (UK sector conversion benchmarks). Adobe's UK ranges point the same way, with fashion and apparel at 1.5% to 3%, consumer electronics at 1% to 2.5%, grocery and FMCG at 3% to 6%, and health and beauty at 2.5% to 4.5% (Adobe UK ecommerce conversion rate optimisation ranges).
Benchmarks are only useful in the right category
A fashion store and an electronics store shouldn't set the same conversion target. Nor should either compare themselves lazily against a site selling craft supplies with high purchase intent and lower decision complexity.
That's why I prefer benchmark conversations that start with buyer intent and journey difficulty, not just “what's a good conversion rate”.
| Sector | Median UK CR | Top Quartile CR | Mobile Share of Traffic | Biggest Friction Point |
|---|---|---|---|---|
| Fashion and apparel | 1.5% to 3% | Not provided in the verified data | Not provided in the verified data | Sizing confidence and returns clarity |
| Consumer electronics | 1% to 2.5% | Not provided in the verified data | Not provided in the verified data | Comparison complexity and spec reassurance |
| Grocery and FMCG | 3% to 6% | Not provided in the verified data | Not provided in the verified data | Basket flow and delivery expectations |
| Health and beauty | 2.5% to 4.5% | Not provided in the verified data | Not provided in the verified data | Ingredient trust and routine fit |
| Arts and crafts | 4.82% | Not provided in the verified data | Not provided in the verified data | Product discovery and stock clarity |
| Electrical and commercial equipment | 0.53% | Not provided in the verified data | Not provided in the verified data | Long decision cycles and technical validation |
Mobile checkout is where a lot of revenue disappears
IRP Commerce also reported 2.23% average ecommerce conversion in August 2026 versus 1.85% in August 2025, alongside the 2.26% figure seen in July 2026, which is a useful reminder that the headline market number has improved while plenty of merchants still leak revenue on everyday mobile journeys (IRP ecommerce market tracking).
The most common issues aren't exotic. They're things like awkward thumb reach, long forms, patchy address validation, hidden delivery costs, limited payment flexibility and payment steps that feel riskier than they should.
Launchwork's UK-focused summary is useful here because it gets specific: 56% of UK abandoners cited hidden delivery costs, 21.8% of cart abandonment was tied to checkout complexity, and only 8% of UK stores had automated cart recovery emails (UK ecommerce conversion optimisation friction points).
On many UK stores, the biggest conversion gain doesn't come from “more persuasion”. It comes from telling people plainly what delivery costs, how long it takes, and letting them buy without unnecessary ceremony.
What good UK CRO work tends to uncover
On real sites, the high-impact findings usually look ordinary when written down:
- Delivery shocks: costs or times revealed too late.
- Guest checkout gaps: forced account creation or unnecessary steps.
- Mobile payment friction: weak support for the payment methods buyers expect.
- Trust timing issues: reassurance hidden where it can't help the decision.
That's the checkout reality. Unflashy, measurable, and expensive when ignored.
Hiring a UK CRO Consultant or Agency Without the Theatre
Hiring for CRO gets much easier when you ignore the pitch and inspect the operating method. You're not buying enthusiasm. You're buying judgement, measurement discipline and the ability to turn findings into shipped changes.
A solo consultant can work well when you need senior thinking and straightforward delivery. A boutique CRO shop can make sense if you want deeper testing process and a small team around it. A full-service agency is usually better suited when CRO has to sit beside development, analytics and channel work under one roof.
Questions that expose weak programmes
Ask these early, and ask them plainly:
- How do you calculate sample size before a test launches?
- What do you do when results are negative or inconclusive?
- Will you share the raw data, not just the slide deck?
- Who owns the winning variants and tracking setup at the end?
- Do you pre-define the primary metric before launch?
If the answers are vague, that's your answer.
The red flags are predictable
Guaranteed lifts are nonsense. Lock-in to proprietary tools is often a control tactic, not a quality signal. Reporting that talks in circles about “engagement” without tying anything back to a commercial action is another warning sign.
If you're already weighing broader site performance issues alongside CRO, it's also worth understanding what technical SEO consultants do, because many conversion issues turn out to sit in templates, performance, indexing, measurement or platform implementation rather than copy alone.
A mature CRO partner is comfortable saying, “this idea probably won't test well yet because the traffic isn't there.” An immature one will run the test anyway and hope nobody asks about significance.
Choose the model that matches your traffic and team
The right setup usually comes down to three things:
- Traffic volume: enough for meaningful testing, or mainly enough for research and UX fixes.
- Internal capability: whether your team can design, build and QA variants.
- Analytics maturity: whether you can trust the data enough to make decisions.
That's the bit to focus on. Not the theatre, not the jargon, and not the dramatic promises.
If you want a senior pair of hands on this, Sibley Digital helps UK businesses improve the parts that usually decide conversion, including technical SEO, site performance, tracking, landing pages and ecommerce UX. If your traffic is decent but revenue yield is underwhelming, that's usually the point where a proper audit and a realistic test plan start paying for themselves.